The Brief
In an organization with multiple strata of management (senior, middle-level, junior), the performance management is wholly entrusted to the respective managers. While this principle of decentralization is designed to promote efficiency in performance appraisals, it is not without loopholes. A decentralized performance management system enables managers assign ratings without substantiation. They may assign higher performance ratings to their staff to help them get bonuses and stock grants. Worse, they may protect poorly performing employees by giving them false performance ratings. At the end of the performance appraisal period, the average performance rating of all employees in the organization is on the higher side. Therefore, the management is constrained to release performance incentives to employees who never performed up to the desired level.
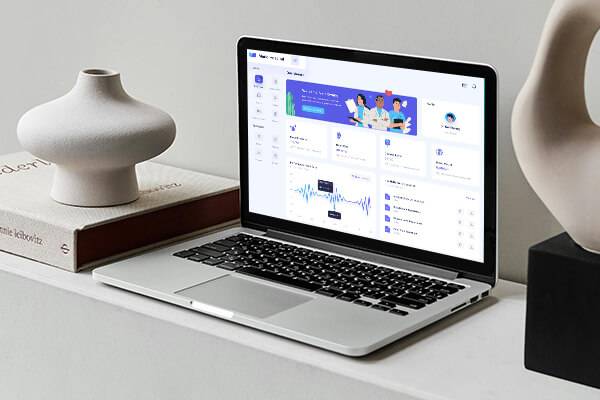
VPM (Visual Performance Management Software) is one such application that is designed to help managers manage the performance of their direct and indirect reporting staff efficiently.
Software Overview
This Visual Management system was designed for a IT Software Company to manage his Employee’s data and daily assigning tasks. VPM has emerged as one of the best ways to manage changes within a project and assign task to each employee. When it comes to improving communication, collaboration and risk identification, visualizing processes and workflows goes a long way.
Service Offered
Client needs to Motivation, recognition, and wants to give reward to employees. Visual Management Boards in Healthcare allows managers to recognize exceptional employee performance as it happens. It helps managers and the organization in general devise ways to retain talent, by motivating and rewarding them in a timely manner.
Remarkable Features
- Change the performance rating of an employee with a simple drag and drop operation
- View the performance and potential rating of an organization in a grid named as the matrix
- Developed in Codeigniter and AngularJS
- View the performance bell curve and bar chart of an organization’s employees
- Search for an employee by entering their name fully or partially. Alternatively, view all the employees in an organization
- View past three years performance of an employee
- Implementing Visual Management Techniques features
- View all recorded feedbacks of an employee in chronological order along with the names of the individuals who provided the feedback
- Record feedback for an employee anytime and not wait for the performance review period to conclude
- View high performers in an organization by selecting a given performance level in the matrix
- Project task management with hourly time spend report
- View the bell curve for a given job code for the entire organization
- Make changes to the performance and potential level of your direct reporting members
- Email performance and potential matrix assignments or changes to multiple recipients
- If your organization records social networking links to employee profiles then launch those links from the screen of the application
Business Impacts
- Easily Manage Employees Monthly Reports
- Track Employee Leaves and records
- Save time to Manage Business Process
- Time tracking by project
- Convenient to Export Business data
- Convenient to Export Business data
- Add Minutes of Meetings and mail to specific persons
- Email Invitations & Reminders
The Result
VPM is implemented by way of a performance and potential matrix. The matrix is a grid arrangement flanked by the performance (x-axis) and potential (y-axis) axes. Each cell in the grid is represented by a performance and potential coordinate. For instance, assume an employee is at 3, 2. This indicates that the performance and potential level of this employee is 3 and 2 respectively. The matrix populates with the performance and potential ratings of multiple employees. You can view the matrix by departments, sub-organizations, management levels and so on. An associated bell curve updates dynamically based on the data in the matrix. The bell curve trajectory provides a realistic interpretation of performances. In addition to the current year’s performance, VPM provides past three years performance data of any employee. This can be accessed anywhere, anytime and within a matter of seconds.